S&P Case-Shiller Analysis & Graphs
Standard & Poor Case-Shiller® home price indices track home prices of 20 major cities. It is divided in a 10-city and a 20-city composite indices. The S&P/Case-Shiller® Home Price Indices are calculated monthly using a three-month moving average.
This post compares the residential housing markets of Denver with the 2 composite indices.
The data is from Standard & Poor CaseShiller® study released on October 30th. There is a two month lag.
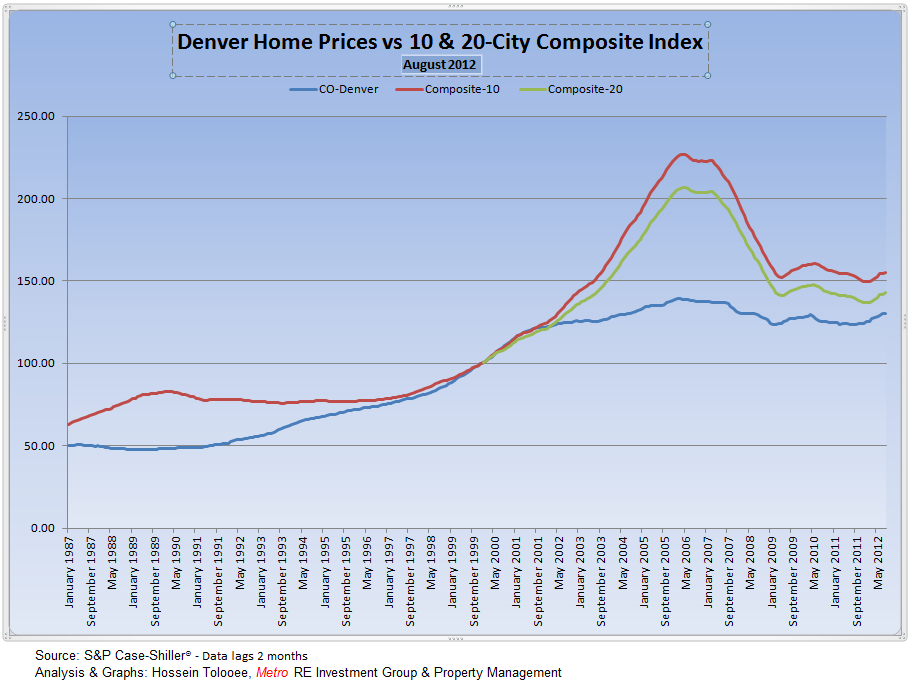
The first chart below depicts the Denver home price index at 130.04 compared to 123.39 of August 2011.
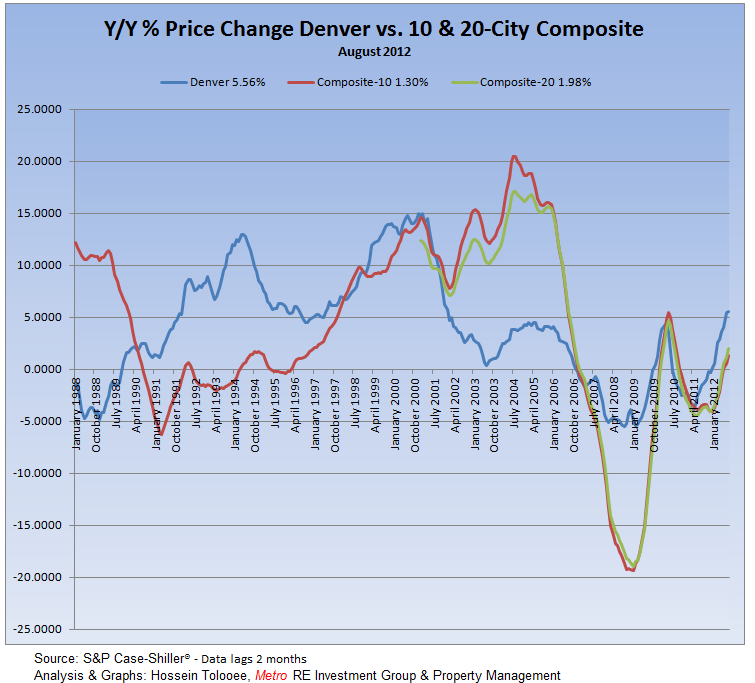
The second chart is the graph of year over year percentage changes showing at 5.56% over a year ago. By far it is the most revealing graph capturing the turbulence in the market we have experienced over the years.
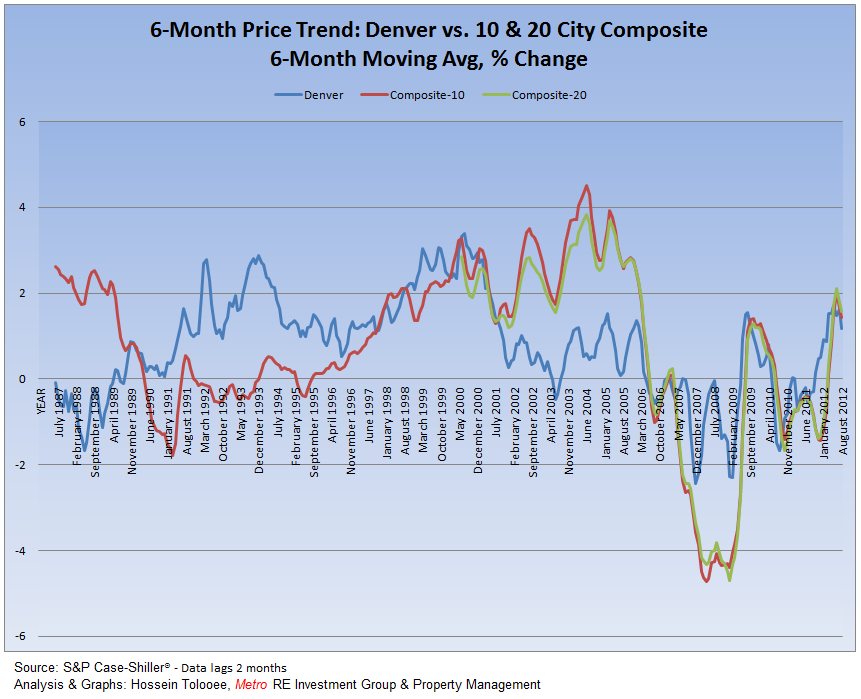
Finally, the last chart is a 6-month trend. It compares the current index with the average of the previous 6 months.
————————————————————————————————————————————————————
The 10-city composite index includes Boston, Chicago, Denver, Las Vegas, Los Angeles, Miami, New York, San Diego, San Francisco, Washington, D.C.
The 20-city composite index adds Atlanta, Charlotte, Cleveland, Dallas, Las Vegas, Minneapolis, Phoenix, Portland, Seattle, and Tampa.
The counties included in Denver-Aurora Metro area are Adams, Arapahoe, Broomfield, Clear Creek, Denver, Douglas, Elbert, Gilpin, Jefferson, and Park.
Source: S&P Case-Shiller® – Analysis & Graphs: Hossein Tolooee, Metro RE Investment Group


